12 Jun 2018
Case: User-friendly and powerful recruitment analytics for TMC
By: Ronald Schep
Based on the weather report.
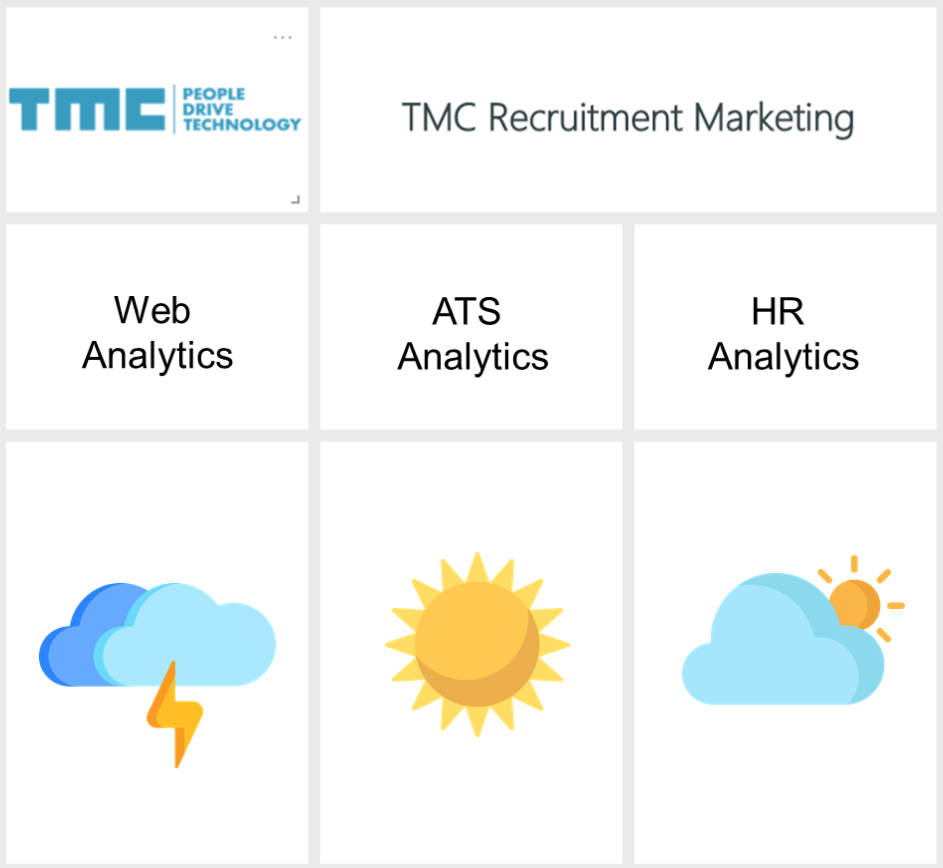
Today it is sunny and exceptionally warm for this time of the year. In the course of this week it can cool off and eventually it evolves to changeable weather accompanied by (thunderous) showers.
What does the weather report has to do with recruitment analytics?
The candidate journey is becoming increasingly important. Organizations that leave a positive impression on candidates are more likely to win top marks and retain the respect of rejected candidates. Measuring the experiences and motivations in each phase of the candidate journey allows organizations to make that difference. But which recruitment analytics do we use for that and what should we focus on? And beyond that, are more reports and dashboards the only answer?
Employeneurship at TMC
TMC is one of our key customers that we help to excel in managing their talent journey by delivering insight through data. TMC is a international high-tech company with self-starting, highly skilled and almost self-employed technical professionals. This Employeneurship model offers engineers from all backgrounds the comforts of employment and the opportunities of entrepreneurship.
Challenge
How to make the impact and efforts within recruitment marketing and -process transparent and understandable, without creating more and more dashboards and reports? Sometimes, they become so complex and big that they are no longer feasible to explain. At that point, they distract from what really matters instead of contribute to a better understanding. TMC wanted to avoid that.
Driver of change
We started with describing the key driver of change: providing insight into stimulus & response, in this case.
Why? In order for someone to change their behavior, we have to show which behavior leads to what effect. And to make it relatable: what actions someone could take to influence or change the effect. In order to really make an impact, it needed to be presented with simple visuals. And with a lot of explanatory effect in itself: a weather report.
Steps
At first we analyzed the business needs in light of the challenge TMC gave us. We have drawn the entire recruitment process from start to finish, from the first website visit until eventually a hire. And for each step we have extensively analyzed and discussed which metric made impact. After that phase we started investigating how we could operationalize the measures (how to measure) and whether the data was already available or whether we needed to measure it.
Solution
During the fourth step, we started modelling the data to transform into a weather report. We discussed and analyzed which measure made impact on the recruitment marketing and -process. We started our model bottom up by assigning weights to all underlying measure. For example, what is the impact of one new LinkedIn follower on a general recruitment marketing figure? Eventually all numbers add up to a general Recruitment Marketing Figure.
Results
The weather report is built as an interactive dashboard in Microsoft Power BI and is now in beta phase. And TMC started using the insight in order to gain momentum and to optimize the underlying data model.
We managed to simplify complex analytical matters into simple, readable and actionable visuals. So that the conversation easily arises and one can focus on what is really necessary. As in our day-to-day lives, the weather is now the talk of the day at TMC.


